
Continue Reading the Letter to Shareholders“We delivered another excellent year of performance in these uniquely challenging times. This was a direct result of incredible execution from all our global colleagues; We owe much gratitude to each of them. Our culture is to “start as a team, finish as a family…”
Josef Matosevic, President and Chief Executive Officer
Dear Fellow Shareholders;
I continue to be very excited about the future of Helios! We are delivering on our promises, driving outsized growth through innovation and diversification, and executing our plan to create greater value for our customers, employees, communities, and shareholders.
In 2021 we had accelerated our growth targets to achieve $1 billion in sales by 2023, two years earlier than planned, driven by strong organic growth complemented by acquisitions. We are also driving profitability with an expectation to achieve approximately 25% adjusted EBITDA margin with a cash earnings compound annual growth rate of 22% or greater.
In fact, we reported excellent 2021 results, which advanced us measurably toward these goals. We demonstrated throughout the year that by implementing our Helios Business System, results can be realized with innovation, determination, resilience, and flexibility. Our organic growth of 27% was a testament to our efforts.
I would like to congratulate the entire Helios family for putting our goals within our reach despite the volatile macro-economic environment.
Solid Execution Delivers Outsized Performance
Strong execution resulted in better-than-expected financial performance. In 2021 we delivered:
- Sales of $869 million, up 66% from $523 million in 2020
- GAAP net income of $105 million, up 637% from $14.2 million in 2020
- Diluted GAAP EPS of $3.22, up 632% from $0.44 in 2020
- Diluted Non-GAAP cash EPS of $4.25, up 90% from $2.24 in 2020
- Paid 100th consecutive quarterly dividend – 25 years of uninterrupted return of capital to shareholders even while investing in growth
It is important to note that we have great financial flexibility and can continue investing in organic growth as well as advancing our acquisition strategy. Our pro-forma net debt to adjusted EBITDA ratio was 1.89x1 below our target of 2.0x at year end and we had over $187 million in liquidity to fund growth.
In fact, during 2021, we generated $113 million in operating cash flow even as we invested in inventory to address the significant material shortages the industry has been experiencing. These investments have helped us maintain top-tier industry lead times and are contributing to our growing market share.
Leveraging Hydraulics and Electronics Leadership
To affect our plan, we clarified our purpose and mission, defined our strategy and supporting tactics, and then put the right structure in place to execute effectively. As a result, during the year we advanced several colleagues to more challenging roles. We also created a structure that increased speed to market with new innovations, simplified our relationships with our customers and enabled sharing of valuable resources.
We expanded our electronic controls technology and enabled further diversification of end markets with the integration of our acquisition of Balboa Water Group that we closed at the end of 2020. The BJN Technologies acquisition in January formed the foundation for the Helios Center of Engineering Excellence (HCEE), which centralized our technology advancements and new product development, enabling us to better leverage existing talents across our businesses.
The NEM acquisition in July enhanced our electro-hydraulic product offering, further developed our presence in OEM markets, provided geographic expansion and added scale to address new markets.
In October, we acquired the assets of China’s Shenzhen Joyonway. This acquisition has strengthened our supply chain through broader geographic reach, increased our manufacturing capacity and provides the ability to better service our customers in keeping with our “in the region, for the region” strategy.
We continued our migration from a holding company to an operating company through 2021. We are integrating several functional areas that will enhance the customer experience lifecycle. We are simplifying the Helios experience by migrating toward a globally integrated sales team, innovation team, and manufacturing team. We believe this augmented approach will reduce customer contact points and create internal efficiencies that will ultimately improve customer satisfaction, increase revenue, drive higher margins, and make Helios that much tougher to follow.
Entering 2022 with Positive Momentum
Over the next few years, we believe we can build on the impressive results of the last two years to achieve our strategic goals by strictly adhering to the four pillars of our augmented strategy. We will (i) Protect the business, (ii) Think and act globally, (iii) Diversify our markets and sources of revenue, and (iv) Develop our talent.
Our strategy for organic growth hinges on the continual evaluation of what we sell, together with where and how we sell it. This drives our manufacturing strategy, our innovation and product development, as well as our customer relationships.
In Hydraulics, we see growth from potential new product innovations in diversified applications and machine automation, in addition to new end market opportunities in recreation, pharmaceutical, thermo-dynamics, and health and wellness. In fact, in 2021 the combined CVT family expertise drove product development teams to exceed expectations by launching 22 new products. This is the greatest number of new product releases in the division’s recent history and will be a flywheel for organic growth in the coming years.
In Electronics, we are looking for growth from product innovations in recreational and off-road displays as well as in machine controllers. We have also identified new growth markets in on-road recreation, commercial food service and bus and transportation, among other markets. We continue to have a strong pipeline of product innovations that we will be introducing over the coming years that will drive our organic growth as well.
Corporate responsibility and sustainability underpin our business strategy. Helios Technologies’ environmental, social and governance (ESG) activities are the living operating principles by which we measure ourselves and shape our behavior daily. In 2021, we established an ESG Committee as a component of our Board of Director’s governance structure. We also made good progress this year measuring some of our baseline environmental data so that we will be able to incorporate these into our manufacturing and operating efficiency planning going forward.
Finally, Forbes Magazine recently named Helios on its List of America’s Best Mid-Size Companies for 2022, a ranking that was based on earnings growth, sales growth, return on equity and total stock return. This is the first time Helios has been publicly recognized as a “mid-sized” company, giving us credit for the tremendous growth we have achieved.
Preparedness and Foresight
The past two years have shown us what success looks like when an extremely talented and relentlessly focused team executes on winning strategies. I believe in our ever-changing world we must be proactive. We must continuously evolve our tactics supporting our strategies so we can maintain our position as a global leader in highly engineered motion control and electronic controls technology for diverse end markets.
Every year I am more excited than the last when I think about the opportunities that lie before us. I appreciate and thank all Helios stakeholders—employees, customers, partners, and suppliers—as well as our Board of Directors. Together we can continue to grow this amazing Company while expanding shareholder value.
Respectfully,
 Josef Matosevic
President and Chief Executive Officer
Josef Matosevic
President and Chief Executive Officer Helios Technologies, Inc.
- On a pro-forma basis for NEM and Joyonway
2021 At A Glance
Revenue
Adjusted Operating Income
22.1% of Sales
Adjusted EBITDA
24.6% of Sales
Diluted Non-GAAP Cash EPS
90% Annual Growth
10-Year Total
Shareholder Return
Number of Countries
Sold Into
Colleagues
of Workforce comprised
of diverse, minority
nationalities

Augmenting Strategy
In 2021 we made significant progress with our augmented strategy to include evolving how we operate from a holding company structure toward an integrated operating company that better leverages sales, marketing, innovation, customer relationships and operational excellence across all our businesses. Below is a summary of our augmented strategies that feed into our Helios Business System (as described in our latest 10K filed March 1, 2022).
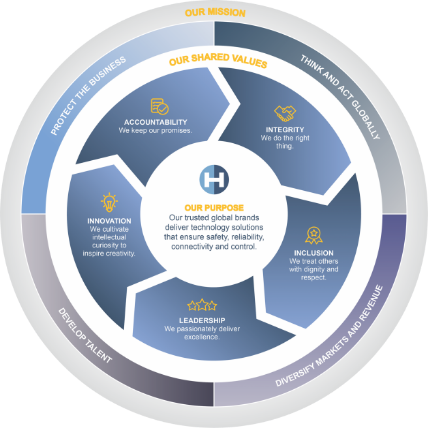
Our Purpose
Our trusted global brands deliver technology solutions that ensure safety, reliability, connectivity and control
Our Mission
Protect the Business
Think and Act Globally
Diversify Markets and Revenue
Develop Talent
Our Definition
Ensure that the cash flywheel continues to spin
Drive intra- and inter-company initiatives that open global markets and leverage resources
Swarm commercial opportunities to diversify global and end-market revenue
Ensure team members are in the right seats and fill key skill gaps for future growth
Our Strategies
- Drive the cash flow engine
- Deliver new products
- Leverage existing products
- Cultivate customer centricity
- Champion a global operating mindset
- Leverage global resources and assets
- Manufacture to support diverse end markets
- Accelerate innovation
- Build in the region, for the region
- Diversify end markets
- Grow wallet share
- Lead with technology
- Address white spaces
- Monetize synergies
- Develop and engage global talent
- Embrace diversity and shared values
- Instill a customer-centric culture
- Promote a learning organization

Advancing Technologies
- Acquires BJN Technologies, LLC, an Innovative Engineering Solutions Provider
- Opening of the Helios Center of Engineering Excellence (HCEE)
- Introduces Helios Business System (HBS) Internally
- Helios Technologies Subsidiary Receives John Deere Supplier Innovation Award
- Helios Technologies Appoints New Chief Commercial Officer
- Helios Technologies Appoints New Managing Director for Enovation Controls
- Helios Technologies Appoints New President of CVT
- Helios Technologies Hosts Hybrid Investor & Analyst Day—Presents Augmented Strategy to Drive Accelerated Performance and Updates Financial Goals
- Helios Technologies Completes Acquisition of NEM S.r.l. Strong Strategic Fit for Hydraulics Segment
- Helios Technologies Furthers ESG Program with Giving Initiative—“Helios Engage”
- Helios Technologies Appoints New Managing Director for Balboa Water Group
- Helios Technologies Introduces New uControl™ Mobile Machine Controller Series
- Helios Technologies Completes Acquisition of Assets of Joyonway, Expanding Electronic Controls Platform Capabilities in Asia
- Helios Technologies Completes Transfer to Begin Trading on New York Stock Exchange
- Helios Technologies Introduces the New Clim8zone™ Heat Pump Integrated Control; First to Market with Innovative Technology

- Helios Technologies Declares 25 Years of Consecutive Quarterly Cash Dividends

Accelerating Growth
Our consistent strong results are driven by our strategic initiatives to protect our business, leverage our manufacturing footprint, advance our innovation pipeline and diversify our markets. As a result, we have been able to hold our lead times and gain market share because of our ability to deliver.

Industrial

Mobile

Agriculture

Other/Recreational

Health & Wellness
2021 REVENUE


Industrial

Mobile

Agriculture

Recreational

Health & Wellness

Consolidated Overview
Of Revenue
Of Revenue
Of Revenue
ESG Matters
In 2021 we made good progress advancing our Environmental, Social and Governance (ESG) efforts across our business. A key to our continued growth and innovation abilities is having a deep awareness and understanding of not only our own environmental and social impacts, but those that shape our entire value chain. This awareness is notably reflected in the integrated approach we use to design and manufacture the components we create—from solutions that reduce our customers’ impact on the environment all the way through to how we source materials and use efficient and safe manufacturing practices.
Meeting our goal of becoming the leading provider of premier products and solutions in niche markets through innovative product development and acquisition requires an overarching approach that addresses the environmental and social aspects of our entire business. Every component of our Helios Business System, starting with our Purpose, the structures we are creating to reach our goal, and our clear step-by-step tactics reflect this. Our Shared Values and Mission ensure it, allowing and embedding that focus across our organization. More importantly, our market performance proves the value of employing these key ESG enablers throughout Helios.
We invite you to read about our progress and follow our journey at https://heliostechnologies.com/esg
“Helios Technologies’ environmental, social and governance (ESG) responsibilities are the living, operating principles by which we measure ourselves and shape our behavior on a daily basis.”
Josef Matosevic, President and Chief Executive Officer
Operations Other Financial
Data Balance Sheet
Data MD&A Results
of Operations Non-GAAP Adjusted Operating
Income Reconciliation Adjusted EBITDA
Reconciliation Non-GAAP Cash Net
Income Reconciliation Non-GAAP Adjusted
Cash from Operations
Corporate Information
Directors
-
Philippe Lemaitre
Chairman of the Board
Helios Technologies
Chairman, President, CEO, retired
Woodhead Industries, Inc. -
Marc Bertoneche, PhD
Emeritus Professor,
Business Administration
University of Bordeauxux -
Douglas Britt
President, Chief Executive Officer
Boyd Corporation -
Laura Dempsey Brown
Senior VP, Communications
and Investor Relations, retired
W.W. Grainger, Inc. -
Cariappa (Cary) Chenanda
Vice President
Cummins, Inc. -
Josef Matosevic
President and Chief Executive Officer
Helios Technologies -
Alexander Schuetz, PhD
Chief Executive Officer
Knauf Engineering GmbH
Corporate Officers
- Josef Matosevic President and Chief Executive Officer
- Tricia Fulton Chief Financial Officer
-
Matteo Arduini
President of QRC
(Quick-Release Couplings) -
Jason Morgan
President of CVT
(Cartridge Valve Technology) - Marc Greenberg, Esq. General Counsel and Secretary
Annual Meeting
-
Tuesday, June 7, 2022
9:00 AM CT
The Joseph Hotel
Nashville, TN
Independent Auditors
-
Grant Thornton, LLP
Tampa, FL
Transfer Agent
-
Computershare
Louisville, KY
Corporate Headquarters
-
Helios Technologies
7456 16th Street East
Sarasota, FL 34243
941.362.1200
www.heliostechnologies.com
Common Stock Information
-
New York Stock Exchange
Symbol: HLIO
Investor Relations
- Tania Almond Vice President of Investor Relations, Corporate Communication and Risk Management Investor@HeliosTechnologies.com
- A copy of the Company’s Form 10-K, filed with the Securities and Exchange Commission, will be furnished free of charge on written request to:
-
Helios Technologies
Investor Relations
7456 16th Street East
Sarasota, FL 34243
Downloads

Common Stock Information
This annual report contains “forward-looking statements” within the meaning of Section 21E of the Securities Exchange Act of 1934, as amended. Forward-looking statements involve risks and uncertainties, and actual results may differ materially from those expressed or implied by such statements. They include statements regarding current expectations, estimates, forecasts, projections, our benefits, and assumptions made by Helios Technologies, Inc. (“Helios” or the “Company”), its director or its officers about the Company and the industry in which it operates, and assumptions made by management, and include among other items, (i) the Company’s strategies regarding growth, including its intention to develop new products and make acquisitions; (ii) the Company’s financing plans; (iii) trends affecting the Company’s financial condition or results of operations; (iv) the Company’s ability to continue to control costs and to meet its liquidity and other financing needs; (v) the declaration and payment of dividends; and (vi) the Company’s ability to respond to changes in customer demand domestically and internationally, including as a result of standardization. In addition, we may make other written or oral statements, which constitute forward-looking statements, from time to time. Words such as “may,” “expects,” “projects,” “anticipates,” “intends,” “plans,” “believes,” “seeks,” “estimates,” variations of such words, and similar expressions are intended to identify such forward-looking statements. Similarly, statements that describe our future plans, objectives or goals also are forward-looking statements. These statements are not guaranteeing future performance and are subject to a number of risks and uncertainties. Our actual results may differ materially from what is expressed or forecasted in such forward-looking statements, and undue reliance should not be placed on such statements. All forward-looking statements are made as of the date hereof, and we undertake no obligation to update any forward-looking statements, whether as a result of new information, future events or otherwise. Factors that could cause actual results to differ materially from what is expressed or forecasted in such forward-looking statements include, but are not limited to: (i) conditions in the capital markets, including the interest rate environment and the availability of capital; (ii) changes in the competitive marketplace that could affect our revenue and/or cost bases, such as increased competition, lack of qualified engineering, marketing, management or other personnel, and increased labor and raw materials costs; (iii) risks related to health epidemics, pandemics and similar outbreaks, including, without limitation, the current COVID-19 pandemic, which may have material adverse effects on our business, financial position, results of operations and cash flows; (iv) new product introductions, product sales mix and the geographic mix of sales nationally and internationally.